
折线图绘制思路
- 绘制坐标轴
- 利用 Canvas 画布缩放的能力
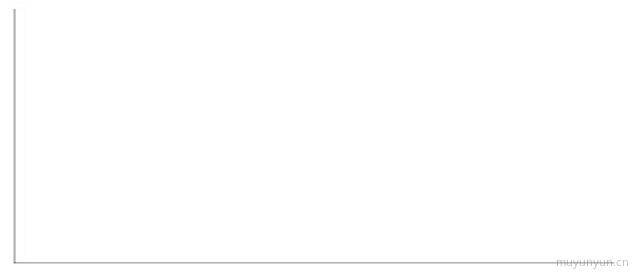
const createCoordinateSystem = () => {context.scale(1, -1)context.translate(0, -height)context.beginPath()context.moveTo(0, 0)context.lineTo(width, 0)context.stroke()context.strokeStyle = '#000'context.beginPath()context.moveTo(0, 0)context.lineTo(0, height)context.stroke()context.strokeStyle = '#000'}
- 绘制平行 X 轴的线条
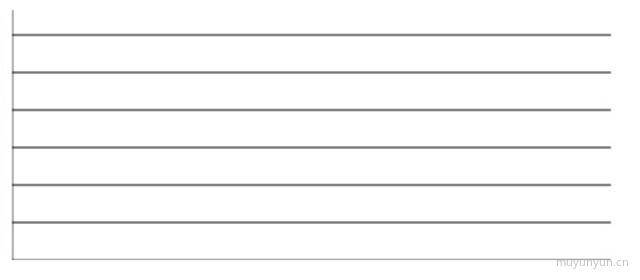
for (let i = 0; i < 6; i++) {context.translate(0, 30)createLine(0, 0, width, 0)}
- 绘制刻度
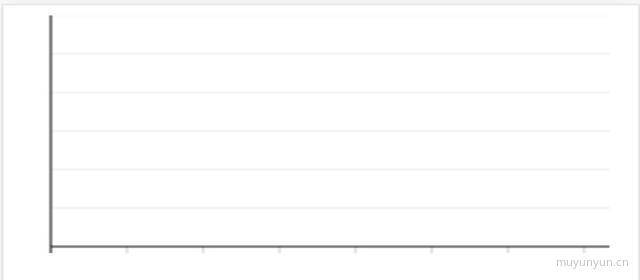
context.save()// 绘制坐标轴...context.restore()for (let i = 0; i < 8; i++) {createLine(0, 0, 0, -5)context.lineWidth = 0.2context.translate(45, 0)}
- 绘制 x 轴下方文字
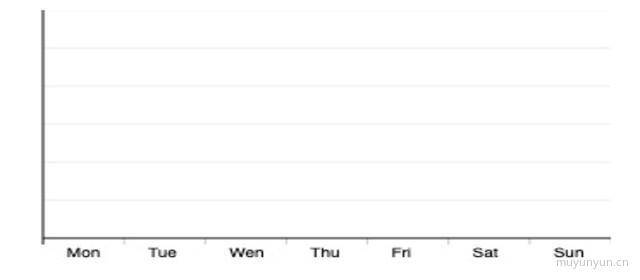
// 绘制 x 轴下方文字ctx.save()ctx.scale(1, -1)for (let i = 0; i < xArr.length; i++) {ctx.fillStyle = '#000'if (i === 0) {const textWidth = ctx.measureText(xArr[i])ctx.translate(perXLength / 2 - textWidth.width / 2, 15)} else {ctx.translate(perXLength, 0)}ctx.fillText(xArr[i], 0, 0)}ctx.restore()
- 绘制折线与圆
// 绘制折线ctx.save()for (let i = 0; i < xArr.length - 1; i++) {ctx.fillStyle = '#000'const curPointX = (1 / 2 + i) * perXLengthconst curPointY = valueArr[i]const nextPointX = (1 / 2 + i + 1) * perXLengthconst nextPointY = valueArr[i + 1]this.drawLine({ ctx: ctx, x0: curPointX, y0: curPointY, x1: nextPointX, y1: nextPointY })}ctx.restore()// 绘制圆ctx.save()for (let i = 0; i < xArr.length - 1; i++) {ctx.fillStyle = '#000'const pointX = (1 / 2 + i + 1) * perXLengthconst pointY = valueArr[i + 1]ctx.beginPath()ctx.arc(pointX, pointY, 2, 0, Math.PI * 2, true)ctx.stroke()}ctx.restore()
todo: 平滑的折线图: https://juejin.cn/post/6950684708443258894#heading-23